Any healthcare project seeks to solve its client’s problems, increase performance, and improve outcomes. After the space is built and occupied, we sometimes realize that users didn’t embrace the change we thought they would or that in solving one problem we inadvertently created another. Simulation technology is an effective tool to test proposed solutions and overcome user doubts before we build.
Leveling the Playing Field
It can be difficult for clinicians to understand the implications of design decisions. Their perception of space is often more shaped by a memorable event than daily occurrences. They may see a symptom as the problem or may jump to “common sense” solutions that won’t really address their problems (“we just need more rooms”).
Architects can also bring preconceived ideas and unexamined biases to the table. For example, we can shape the discussion of design options through the information we share or we might selectively hear comments that support our preferred solution.
Right-Sizing and Simulation Modeling
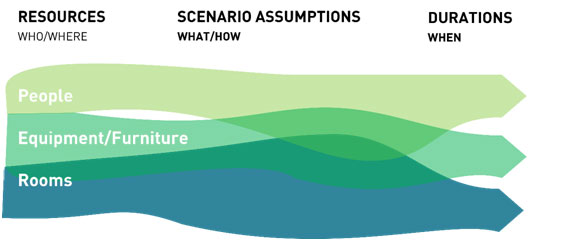
Simulation modeling is a great tool to use to avoid these challenges. A good model synthesizes three types of data to understand how a design will perform. It accounts for:
- The people, equipment/furniture, or rooms that occupy a space.
- Scenarios Assumptions. Care pathways and likelihood of certain procedures happening.
- Durations. This includes data regarding the duration of visits, procedures, and support activities
By assigning resources according to likely scenarios and understanding how long each step takes, a performance profile emerges. Problems vs. symptoms are clear(e.g., patients backed up in the waiting room is a result of a shortage of Medical Assistants).
Many modelers input overly simplistic data that often confirms expectations. Dynamic programming offers a better model. It collects and analyzes complex, multivariant data to compare operational strategies and right-size programs. Its advantages are many:
- Mapping how staff, patients, and visitors actually use their spaces, identifies bottle-necks and accurately shows space utilization. Drawn from current practices, these insights foster productive discussions around space and staffing efficiencies.
- Refine the design to obtain a more efficient use of the facility by running alterate scenarios.
- Integrates lean processes and evidence-based design to build and run alternative care scenarios.
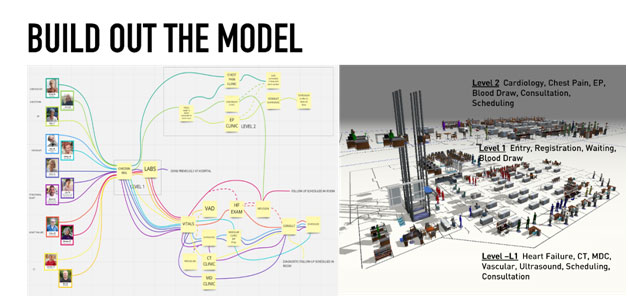
Building Out the Simulation
Once we’ve gathered this information from our client and understand the resources needed, typical treatment paths (and possible deviations), and data associated with each step, we can begin to build out the model as digital space and as the patient process-flow. The digital model is generated based on floor plans. We then populate the model with the fixed physical resources (exam tables, registration kiosks, MRI machines, etc.) as well as the dynamic physical resources (an EKG cart or gurney which will move from its ‘home’ location to patients). Staff resources such as a Reception Clerk, MA, or Doctor are then generated. Staff resources are dynamic, moving from patient to patient and to a ‘home’ location. They can be assigned to multiple patients simultaneously and have schedules associated with their shift availability.
Once the digital space is created, we generate the department’s patient process-flows. This is a step-by-step process of various patients’ care pathways through their visit. It’s here that we incorporate the statistical data collected (distribution percentages, processing times, maintenance schedules, and so on) to determine the likelihood a patient will take a particular pathway of care and the amount of time their visit will last. A typical process flow may go as follows: Patient enters the facility, patient registers at the desk with a registration clerk, patients sits in the waiting area, patient is escorted back to exam room by MA, MA takes vitals and history, patient visits with MD, MA returns to draw blood, MA escorts patient out of the facility.
Simulation Overview
After we’ve generated the model we run the simulation for a prescribed period of time and begin to make observations in our model. There are two types of observation:
- Visual observations of the patients, staff, and resources moving through the digital space
- Statistical data gathered in running the model. Both are critical to the completing the picture.
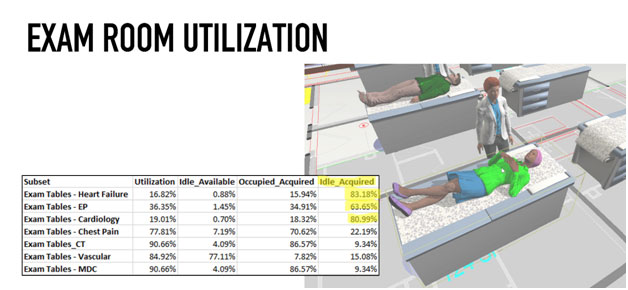
For example, in one simulation we were challenged with right-sizing a shared waiting area for an institute that was combining several different clinics into a single location with shared registration and waiting. Each clinic previously had their own dedicated registration and waiting areas. After running the simulation for a typical day, we were visually observing an unacceptably long line for registration and a completely full waiting area. On the surface, the solution would be to increase the waiting area to allow more patients to effectively register and move on to the next step. However, the statistical data pointed to a different issue. Analyzing staff utilization rates, we found the MA utilization was incredibly high (over 95%) while exam room utilization rates were well below what was expected. The model revealed that the MAs were so overburdened with their daily tasks that they did not have adequate time to move patients out of waiting into their assigned exam rooms.
The solution was a process change. By assigning this task to a nurse navigator, we reduced the Ma’s utilization rates to a manageable level, increased exam room occupancy rates, and freed up our registration/waiting area. Because we were able to run the simulation, we were able to create a shared reception and waiting area, reduce the necessary square footage, improve our client’s workflow, and lighten staff burdens to better and more efficiently care for their patients.
Conclusion
A simulation model that accurately reflects the resources, scenarios, and durations of clinical activities tests design and operational assumptions. Variables in the model can be adjusted to understand the impacts of operational changes. Design options can also be tested by building out new models and transferring the simulation data to each one. Dynamic programming via simulation is a great resource to ensure that you are right sizing spaces and identifying change management issues before they become problems to overcome in a new space.